

Spotify Got My Top Artists WRONG 😱😱😱
and now i must unwrap and rewrap my wrapped to SOLVE THE CASE

I love Spotify Wrapped. I have a group of former colleagues that participate in a “Wrapped Swap”, where we all submit our top song, and then as a group we try to guess whose song is whose. It’s a delight.
But something is amiss. While the Top Songs list is always impeccably selected, something has seemed… suspicious… about my Top Artists.

As you can see, four of these top artists are simply the performers of top songs.
I was promised distinct Top Artists and Top Songs! Recycling one list for another is not fair! I’m a paying Spotify Premium customer!
I had to dig deeper. And so I exercised my GDPR-given right to request my Spotify listening history, and with a little analysis in Python, I was able to replicate the Top Artists list.
And what I found confirmed my concern.
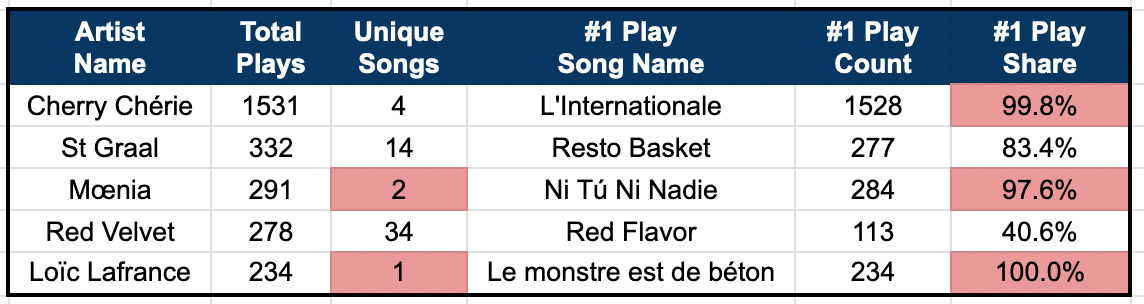
Aha! We can clearly see that four artists have one song accounting for a large majority of their plays. And in three of those cases the “#1 Play Share” is within 2.5 percentage points of 100%.
The most egregious claim is my #5 “Top Artist”. I only listened to one Loïc Lafrance song! I don’t even know how to type that cute little letter in his name! I copy-pasted it! And while his song “Le monstre est de béton” is indeed a nice jam, I will NOT learn how to type that double-dotted-i until Mssr. Lafrance produces another song that I listen to!
(You can listen to it below.)
The Mystery Deepens…
Spotify is hiding something from me. But I won’t give up.
I want to see how my listening to artists is distributed across their various tracks. Certainly there must be examples of artists that I consume more broadly. But how can I explore this data?
Let’s examine how much time is spent on each of my top 10 most-listened tracks from each of my most-listened-to artists.
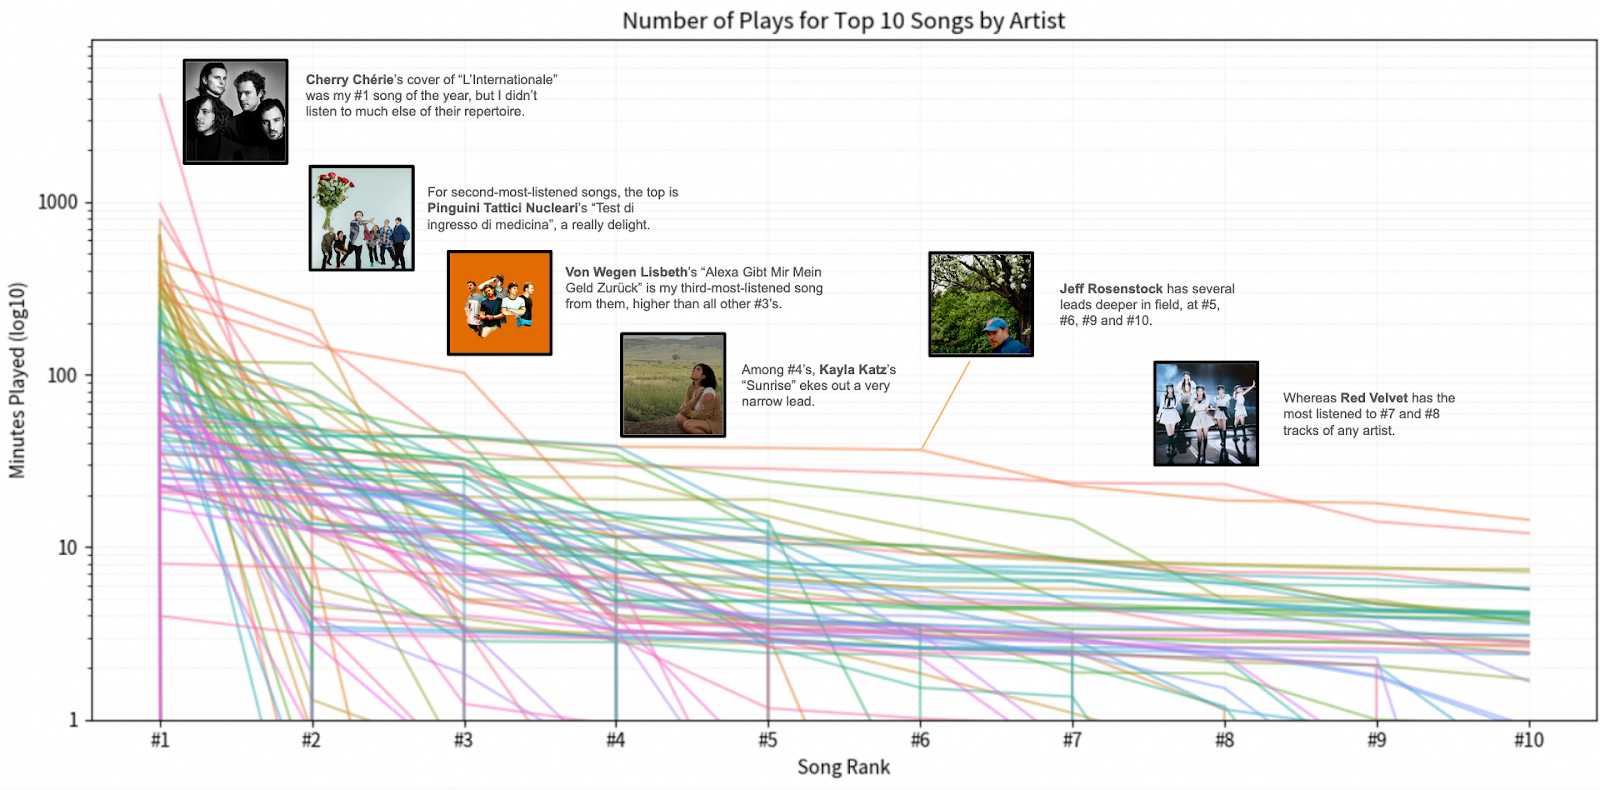
This gives a sense for the range of possible distributions. It isn’t so simple that there is a “single-song” top artist and a “deep-library” top artist. Depending on where I draw the threshold, I get a different answer.
Is there an easier way to view the full range of possibilities?
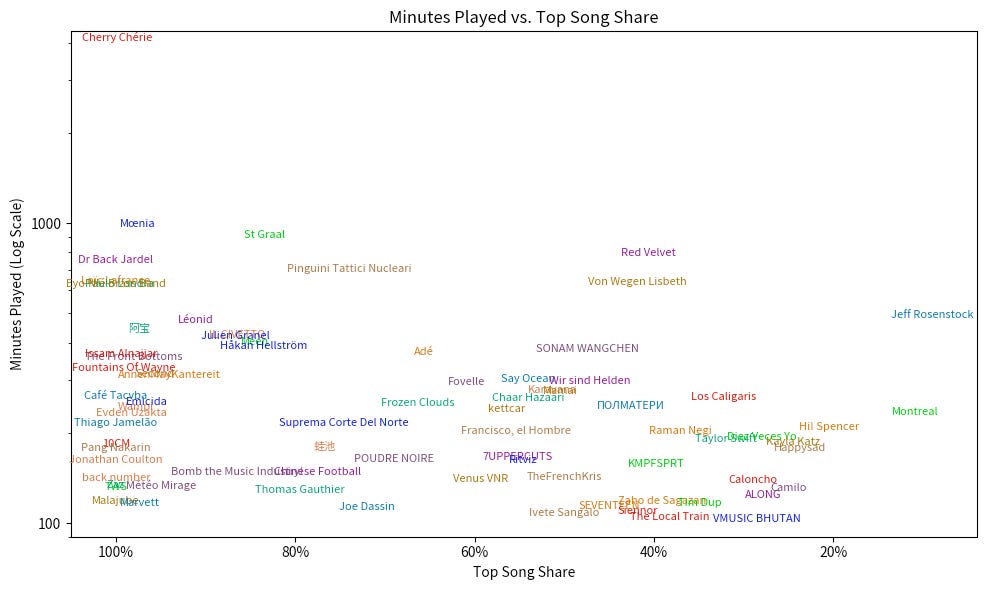
And so, I plot all 78 artists with over 100 minutes of listening in Wrapped-eligible1 2024. I see the same artists that popped in the previous graph, but because I’ve focused in on the “#1 song share” exclusively I see a broader range of contenders.
With each new answer, more questions pop up. There’s a lot in here. I’ll need more time to sort it out.
We have a real caper on our hands. And like all good capers, this will roll out week-by-week, procedural style! Be assured: we WILL figure out who my REAL top artist is. I am just the data detective2 for the job.
If you aren’t subscribed, please join the fun as we resolve this mystery. Come back next week for a full rundown of the main suspects for “Top Artist”! I’ll be asking folks to vote for their favorite methodology so we can answer this question once and for all.
This has been a Monday Medi(a)tation, a weekly data-driven reflection on my personal media usage. Each Monday, I will take a personal media dataset of my own and explore it to get a better understanding of the role media plays in my life.
If you are interested in having any of the above graphs created for your own media data, I have the scripts all ready to run so just message me and I’ll talk you through the process and share the output back with you!
A couple quick loose threads from Saturday’s newsletter:
Transitive Property of Camaraderie: I realized there might be some people on the newsletter that didn’t fit the “partners in labor” framing I wrote about, so I wanted to make it clear that labor is transitive -- so if you labored in school with someone who labored in a household with someone who labored in a workplace with me, then we’re comrades in my books! And also, just reading this newsletter makes you a partner in labor! (Reading is work! Writing is work!) And hopefully at some point you’ll either comment or even actively participate in the data-driven reflections yourself! Just message me if you’re interested in seeing your own data plotted!
Considerate Lengths: I saw that Substack estimated my previous newsletter as a “21-minute read”, which is longer than I was going for! (A whole sitcom episode of reading!) In the future, I’ll try to shoot for closer to 5-10 minutes per newsletter. Thanks for your patience as I learn the ropes of this!
To align with the results of Wrapped, I’m only including listening behavior up until October 2024. (For now…)
The… data-ective?
honored to be mentioned even if not by name!!!